
As of today nobody has found a bullet proof formula to win the Eurovision Song Contest. The song, the performance and the staging are the most obvious success criteria, but we all know that this time of year another criterion is what we are all talking about – the running order. A starting position at the end of the event is thought to be a guaranteed qualification, while starting in the first half is held to be unfavorable.
The numbers
But what do the numbers actually say? Looking at the success rate of starting positions is not so straight forward. From 2004 to 2007 the competition only had a single Semi Final, which is skewing the data a bit. If we assume that starting in the last positions is favorable, then it matters for the statistics whether there were 26 or 18 entries. Further complicating matters is that there is a variable number of entries per year even after the dual semi finals were introduced.
The changes in the voting system in 2008 and 2009 have also biased the qualifications stats on some starting positions. For these 2 years only top 9 in the Tele Vote was guaranteed a spot in the Final, while the last country to qualify was decided by the back-up juries.
In 2008, Sweden (R/O* 2) qualified at the expense of FYR Macedonia (R/O 18) in Semi Final 2. In 2009 Finland (R/O 15) qualified at the expense of FYR Macedonia (R/O 13) in Semi Final 1 and Croatia (R/O 1) qualified at the expense of Serbia (R/O 4) in Semi Final 2. As a consequence starting in position 15 in Semi Final 1 and position 1 and 2 in Semi Final 2 has benefited from an artificial boost in the statistics.
Semi Final 1 vs. Semi Final 2
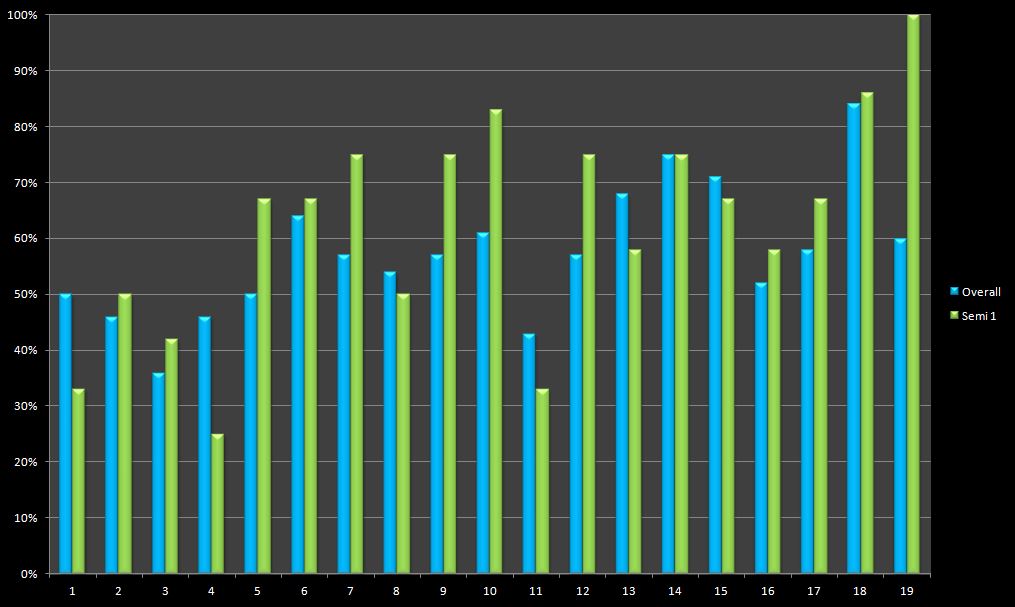
Surprisingly there is a tremendous yet inexplicable difference between the success rate of a position, depending on whether it is in Semi Final 1 or Semi Final 2.
Below is a chart of starting positions and their respective success rate for semi finals. The blue bars are the overall success rate for all semi finals and the green bars indicate the success rate of a position in Semi Final 1 exclusively.
Position 2 in the running order is often called the “draw of death”. However the statistics of the semi finals tell another story. In Semi Final 1 position 1, 4 and 11 all have lower qualification rates than position 2 and overall position 3, 4 and 11 all have lower qualification success rates.
It is generally better to start in the second half of a semi final, especially if your entry is at the very end of the show. Not shown in the graphic above are the statistics for positions that were performed last or second to last in their shows.
If we look at all semi finals since 2004 and the rankings of songs performed in the last position and second to last, they have a 81% and 73% qualification rate respectively.
On the other hand starting in the first half is not quite so bad, with some of the positions outranking many of the ones in the second half.
Obviously if starting position were all that mattered we would be seeing 100% and 0% bars. Starting position is only part of the puzzle.
The Eurovision Song Contest isn’t a position lottery, it’s a song contest. There is clearly more to it. Maybe a favorable starting position can help push a mediocre song into the 10 qualifiers, and an unfavorable position can help deny a mediocre song qualification. On the other hand a strong entry is going to qualify regardless of starting position.
Predicted Qualifiers according to Running Order
Leaving out everything else, with the data for running orders we can try to predict some qualifiers. In the first semi final 58.8% will qualify, since there are 17 entries and 10 of those go on to the final.
Going by the running order statistics for semi final 1 alone, we can expect the following countries to qualify:
- Belgium (83%)
- Hungary (75%)
- Serbia (75%)
- Australia (75%)
- Estonia (75%)
- Slovenia (67%
- Czech Republic (67%)
- Portugal (67%)
- San Marino (67%)
- Iceland or Greece (58%, tied for 10th place)
I’m not entirely sure we can rely on the statistics for running order alone to predict the results of the first semi final. A real statistician might even point out that the sample size is way too small to say anything useful based on the data. It’s fun though.
Qualification percentage
| Country | R/O | Overall % | Semi 1 % |
|---|---|---|---|
 | 1 | 50 % | 38 % |
 | 2 | 46 % | 46 % |
 | 3 | 36 % | 38 % |
 | 4 | 46 % | 23 % |
 | 5 | 50 % | 69 % |
 | 6 | 64 % | 69 % |
 | 7 | 57 % | 69 % |
 | 8 | 54 % | 54 % |
 | 9 | 57 % | 77 % |
 | 10 | 61 % | 77 % |
 | 11 | 43 % | 31 % |
 | 12 | 57 % | 77 % |
 | 13 | 68 % | 62 % |
 | 14 | 75 % | 77 % |
 | 15 | 71 % | 62 % |
 | 16 | 52 % | 62 % |
 | 17 | 58 % | 67 % |
| These countries may vote |
|---|
                    |
* R/O=Running Order


")


")
")
")
Comments are closed.