
Last week we looked at how the starting position of an entry can affect it’s final ranking in a semi final. We found that there is a surprising difference between starting positions in semi final 1 and semi final 2.
As we noted in the previous two articles, there is some truth to the feeling among fans that the second half is the better draw for an entry. Not quite as profound as some would have you believe, but the difference is there.
Voting Histories
Another point that comes up often is the notion that some countries tend to award their points to their friends. Or rather we tend to vote for entries that sound like the music we’re used to hearing. This fact comes as a surprise to no one, least of all the EBU. From the allocation draw article on eurovision.tv:
The 36 Semi-Finalists have been allocated into six pots, based on historical voting patterns as calculated by the contest’s official televoting partner Digame. Drawing from different pots helps to reduce the chance of so-called neighbourly voting and increases suspense in the Semi-Finals.
The EBU is basically seeding the semi final draws to try and combat the trend of friends voting for friends. But that won’t keep us from analyzing the voting histories of the voters in semi final 1!
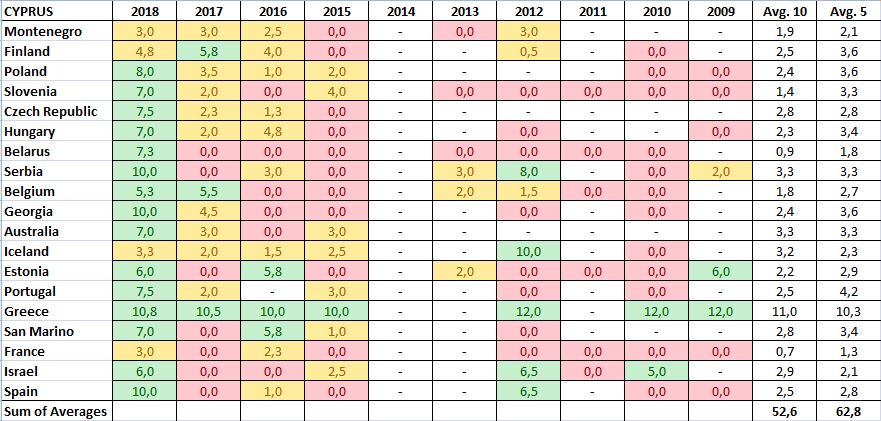
We use windows of 5 and 10 years to produce a sum of averages for each eligible voter in semi final 1, for each participant. We do that by taking the average of each year for each voter, then averaging those averages to produce an average of averages for each voter to each participant. Lastly we produce a sum of averages to get a final point score we can rank each entry by. Dizzy yet? I certainly was.
Numbers, averages and sums
As an example, below is the vote history table for Cyprus with all the eligible voters in this year’s semi final 1. For the last 10 years we can produce an average point award for each voter. This allows us to calculate an average point award over a “window” of time, such as 5 years and 10 years. With these averages we can produce a “sum of averages” that can tell us the amount of points an entry can expect to receive.
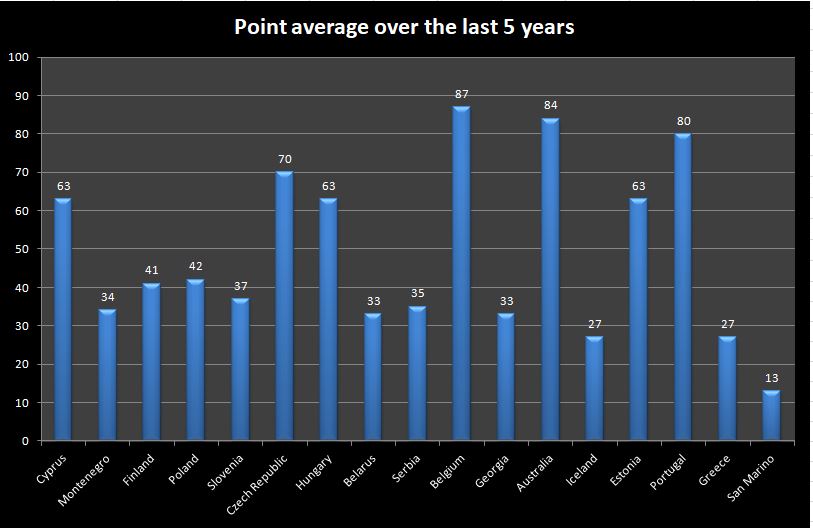
With a whole bunch of tables just like the one for Cyprus, we can create a chart of expected point sums for semi final 1.
Predicted Qualifiers
With all the math done and charts drawn, we can use the 5 year window to try and predict the qualifiers for semi final 1:
- Belgium (87 points)
- Australia (84 points)
- Portugal (80 points)
- Czech Republic (70 points)
- Cyprus (63 points)
- Estonia (63 points)
- Hungary (63 points)
- Poland (42 points)
- Finland (41 points)
- Slovenia (37 points)
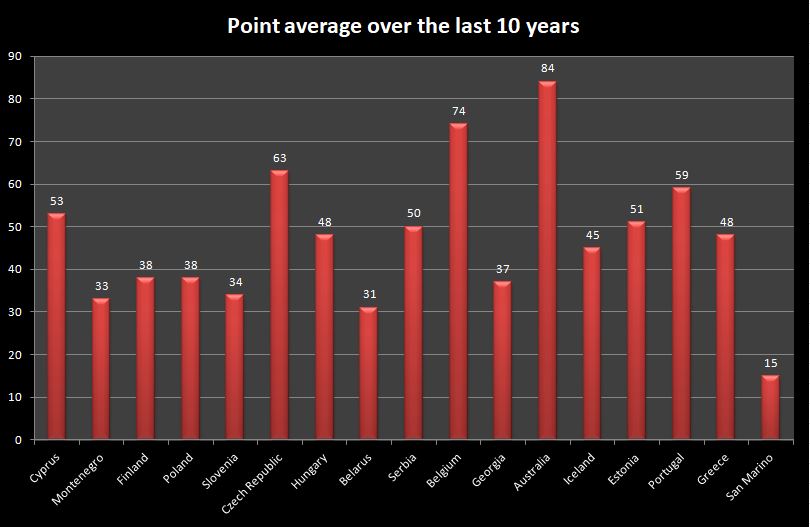
And the predicted qualifiers for the 10 year window are:
- Australia (84 points)
- Belgium (74 points)
- Czech Republic (63 points)
- Portugal (59 points)
- Cyprus (53 points)
- Estonia (51 points)
- Serbia (50 points)
- Hungary (48 points)
- Greece (48 points)
- Iceland (45 points)
Greece, Serbia and Iceland makes the list at the expense of Finland, Poland and Slovenia.
| Country | R/O | Average 5 years | Average 10 years |
|---|---|---|---|
 | 1 | 63 | 53 |
 | 2 | 34 | 33 |
 | 3 | 41 | 38 |
 | 4 | 42 | 38 |
 | 5 | 37 | 34 |
 | 6 | 70 | 63 |
 | 7 | 63 | 48 |
 | 8 | 33 | 31 |
 | 9 | 35 | 50 |
 | 10 | 87 | 74 |
 | 11 | 33 | 37 |
 | 12 | 84 | 84 |
 | 13 | 27 | 45 |
 | 14 | 63 | 51 |
 | 15 | 80 | 59 |
 | 16 | 27 | 48 |
 | 17 | 13 | 15 |
| These countries may vote |
|---|
                    |
Suggested reading:
Semi Final 1 Running Order – Analysis and Qualifiers


")
")
")

")
")