
Last week we looked at how the starting position of an entry can affect it’s final ranking in a semi final. We found that there is a surprising difference between starting positions in semi final 1 and semi final 2.
As we noted in the previous two articles, there is some truth to the feeling among fans that the second half is the better draw for an entry. Not quite as profound as some would have you believe, but the difference is there.
Voting Histories
Another point that comes up often is the notion that some countries tend to award their points to their friends. Or rather we tend to vote for entries that sound like the music we’re used to hearing. This fact comes as a surprise to no one, least of all the EBU. From the allocation draw article on eurovision.tv:
The 36 Semi-Finalists have been allocated into six pots, based on historical voting patterns as calculated by the contest’s official televoting partner Digame. Drawing from different pots helps to reduce the chance of so-called neighbourly voting and increases suspense in the semi-finals.
The EBU is basically seeding the semi final draws to try and combat the trend of friends voting for friends. But that won’t keep us from analyzing the voting histories of the voters in semi final 2!
We use windows of 5 and 10 years to produce a sum of averages for each eligible voter in semi final 2, for each participant. We do that by taking the average of each year for each voter, then averaging those averages to produce an average of averages for each voter to each participant. Lastly we produce a sum of averages to get a final point score we can rank each entry by. Dizzy yet? I certainly was.
Numbers, averages and sums
As an example, below is the vote history table for Azerbaijan with all the eligible voters in this year’s semi final 2. For the last 10 years we can produce an average point award for each voter. This allows us to calculate an average point award over a “window” of time, such as 5 years and 10 years. With these averages we can produce a “sum of averages” that can tell us the amount of points an entry can expect to receive.
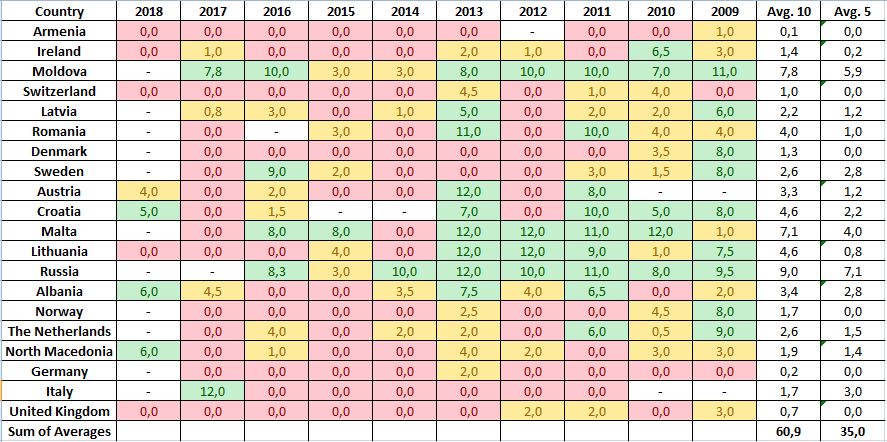
Ouch! Looks like Azerbaijan landed in a semi final without a lot of friends around. Especially in the 5 year window Azerbaijan is not looking so hot. The 10 year window is mainly saved by their victory in 2011 and their very strong rankings in both 2012 and 2013.
Like we did for semi final 2, we can now compile two charts showing the expected score for each participant, for the 5 year and 10 year windows respectively.
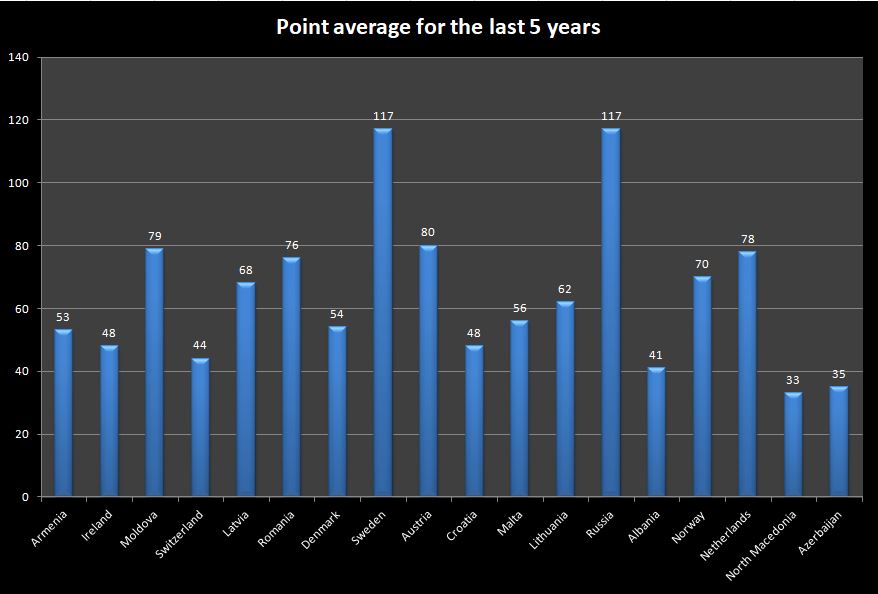
The 5 year window predicts the folloing qualifiers for semi final 2:
- Sweden
- Russia
- Austria
- Moldova
- The Netherlands
- Romania
- Norway
- Latvia
- Lithuania
- Malta
Sweden and Russia tied for the top spot with 117 points each. At the other end of the qualifiers we see Malta taking the 10th slot in front of Denmark, the two countries separated by merely 2 points. Maybe the 10 year window will be kinder for Denmark?
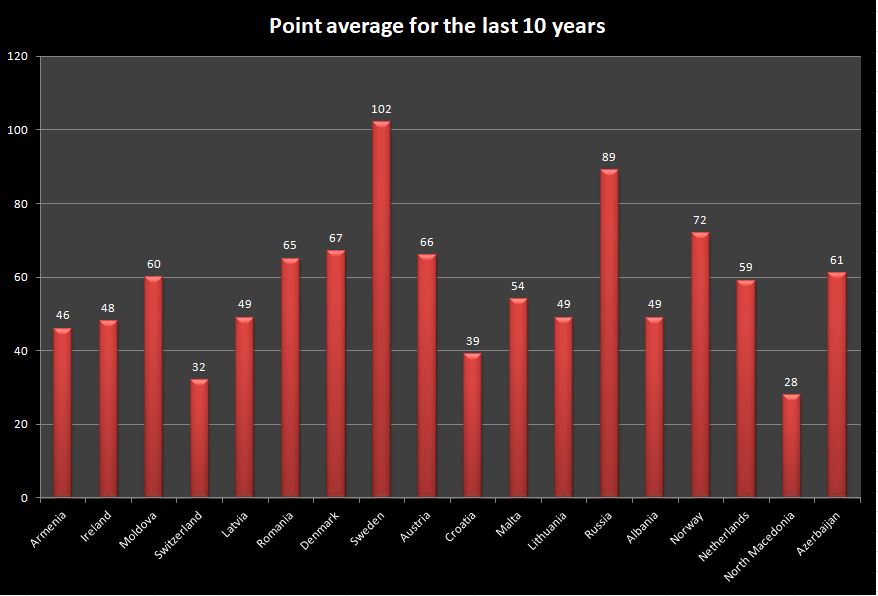
Let’s see. The 10 year window predicts the following result:
- Sweden
- Russia
- Norway
- Denmark
- Austria
- Romania
- Azerbaijan
- Moldova
- The Netherlands
- Malta
Again we have Sweden and Russia at the top two spots, this time though with Sweden in a commanding lead. Denmark and Azerbaijan move into the top 10, which may be an indication that both countries were better in the past. Can either of the two turn their downward slopes around this year?
| Country | R/O | Average 5 years | Average 10 years |
|---|---|---|---|
 | 1 | 53 | 46 |
 | 2 | 48 | 48 |
 | 3 | 79 | 60 |
 | 4 | 44 | 32 |
 | 5 | 68 | 49 |
 | 6 | 76 | 65 |
 | 7 | 54 | 67 |
 | 8 | 117 | 102 |
 | 9 | 80 | 66 |
 | 10 | 48 | 39 |
 | 11 | 56 | 54 |
 | 12 | 62 | 49 |
 | 13 | 117 | 89 |
 | 14 | 41 | 49 |
 | 15 | 70 | 72 |
 | 16 | 78 | 59 |
 | 17 | 33 | 28 |
 | 18 | 35 | 61 |
| These countries may vote |
|---|
                     |


 Narkootikumidest Ei Tea Me (Küll) Midagi” | Panelet bedømmer Estland (ESC 2024)")

")
")
")
")
Comments are closed.